Contact us:
Dr. Zifei Liu

Assistant Professor
Biological & Agricultural Engineering
Kansas State University
043 Seaton Hall
Manhattan, KS 66506
Email: Zifeiliu@ksu.edu
Phone: 785-532-3587
Fax: 785-532-5825
Carbon Footprint
The Concept of Carbon Footprint
A carbon footprint is a measure of the impact of our activities on the environment, and in particular climate change. It is the total GHG emissions caused directly and indirectly by the activities.

A carbon footprint is only one component of the broader ecological footprint. An ecological footprint compares the population's consumption of resources and land with the planet's ability to regenerate.
The CO2-eq units
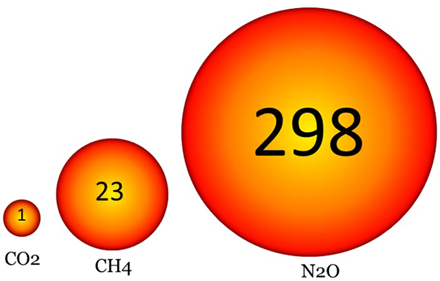
Each GHGs—CO2, CH4, N2O, etc.—has a different global warming potential. Emissions of different gases have to be converted to CO2-eq units so they can be added together to get a picture of total emissions.
Biogenic CO2
The CO2 generated by agriculture is often considered to be biogenic in nature or “carbon neutral” (as contrast to CO2 from fossil-fuel combustion, which adds new carbon to the atmospheric-biospheric circulation system), and therefore sometimes is excluded or deferred in accounting of total GHG emissions.
Carbon footprint (CF) from life cycle assessment (LCA)
Beef cattle production
Most existing beef LCA studies followed a “cradle to farm-gate” approach and they reported CF of feedlot finished beef production in the U.S. in the range of 14 to 27 CO2e per kg carcass weight. The variations in CF among studies were mainly due to differences in finishing weight and time spent in the feedlot, types and amount of feed, manure handling practices, region variability, as well as methods used. These production systems include either 3 phases (cow-calf to stocker to feedlot) or 2 phases (cow-calf to feedlot). Existing studies agreed that the cow-calf phase contributed 67 to 72% of the CF for the overall beef production system. The cow-calf phase requires the maintenance of the large number of breeding animals to produce the calves. Breeding animals may live on the land for a full year to produce a calf, and was responsible for the majority of the CF. Around 66% of total feed consumption to produce beef was allocated to the cow–calf phase. In a Canadian study, it was estimated that about 84% of enteric CH4 was from the cow–calf phase, mostly from mature cows. Therefore, the cow-calf phase deserves significant attention when developing GHG mitigation strategies.
Enteric CH4 emissions were consistently the largest contributors to the total CF, while both manure management and feed production also make substantial contributions. The CF from feed production contributed 11 to 33% to the total CF. In the feedlot phase, feed production was the main contributor, and may account for 60 to 79% of the CF in this phase. Improving feed utilization could be an important strategy to reduce CF for feedlot operations.
The reported CF of grass-fed beef cattle in the U.S. was around 37% higher than feedlot finished beef cattle, which was partly due to longer finishing time, lower finishing weight, and higher forage diet. A 38% reduction in CF through a shift from extensive pasture production of cattle to intensive feedlot production was reported in a Canadian study. For grass-fed beef cattle, N2O emission from grazed pastures was a major contributor to CF, second to enteric CH4 emission. Better management practices in grazing systems could reduce enteric CH4 emissions by as much as 22%. For grazing systems with positive soil organic carbon sequestration potential, substantial reduction in CF may be achieved.
Dairy production
A national LCA study based on data from 2007-2008 in the U.S. reported that CF of milk, from farm to table, averaged 8.0 kg CO2e per gallon (2.0 kg CO2e per kg) of milk consumed, and ranged from 6.9 to 9.4 kg CO2e per gallon of milk consumed due to regional variability (Thoma et al., 2008). The contribution to overall CF by supply chain was 20.3% for feed production, 51.5% for milk production, 5.7% for processing, 3.5% for packaging, 7.7% for transportation/distribution, 6.5% for retail, and 4.9% for consumer. The study included retail and consumption losses of 12% and 20%.
Swine production
A national LCA study estimated CF of U.S. swine production to be 9.9 kg CO2e per kg of boneless pork consumption, and the contribution to overall CF by supply chain was 62.1% for live animal production (9.6% for sow barn and 52.5% for nurse to finish), 5.6% for processing, 1.3% for packaging, 7.5 for retail, and 23.5% for consumer (refrigeration, cooking, and CH4 from food waste in landfill) (Thoma et al., 2011). Feed production and manure management were two major contributors, accounting for 42% and 39%, respectively, for the CF in the live animal production phase. As a comparison, 3.9 to10 kg CO2e per kg of pork product were reported in several European studies.
Poultry production
The CF of U.S. broiler production has been estimation to be 2.5 kg CO2e per kg of edible chicken product (Pelletier, 2008). The U.S. poultry supply chain typically depends on concentrated feed production far from the poultry farm itself, while the upstream feed production, processing, and transportation account for 82% of the total CF of poultry production. As a comparison, 3.7 to 6.9 kg CO2e per kg of edible chicken product were reported in several European studies.
Summary
The reported CF of various activities are presented in Table 1. It should be noted that these data are from different LCA approaches and caution should be applied when comparing them. Nevertheless, it is understandable that, pork and chicken have less CF than beef due to the facts that they produce less CH4 and require less feed and less breeding stock per kg of meat produced.
Table 1. Comparison of carbon footprints (CF) of various activities
|
Activities |
CF (kg CO2e) |
Reference |
|
Consuming one kg of beef |
18.8 |
Roop et al., 2014 |
|
Consuming one kg of boneless pork |
9.9 |
Thoma et al., 2011 |
|
Consuming one gallon of milk |
8.0 |
Thoma et al., 2008 |
|
Consuming one kg of chicken |
2.5 |
Pelletier, 2008 |
|
Driving a car and consuming one gallon of gasoline |
9 |
Walser, 2013 |
|
Consuming one kWh electricity that generated from coal |
0.9 |
World Nuclear Association, 2011 |