Daily Erosion Project
Daily Erosion Project
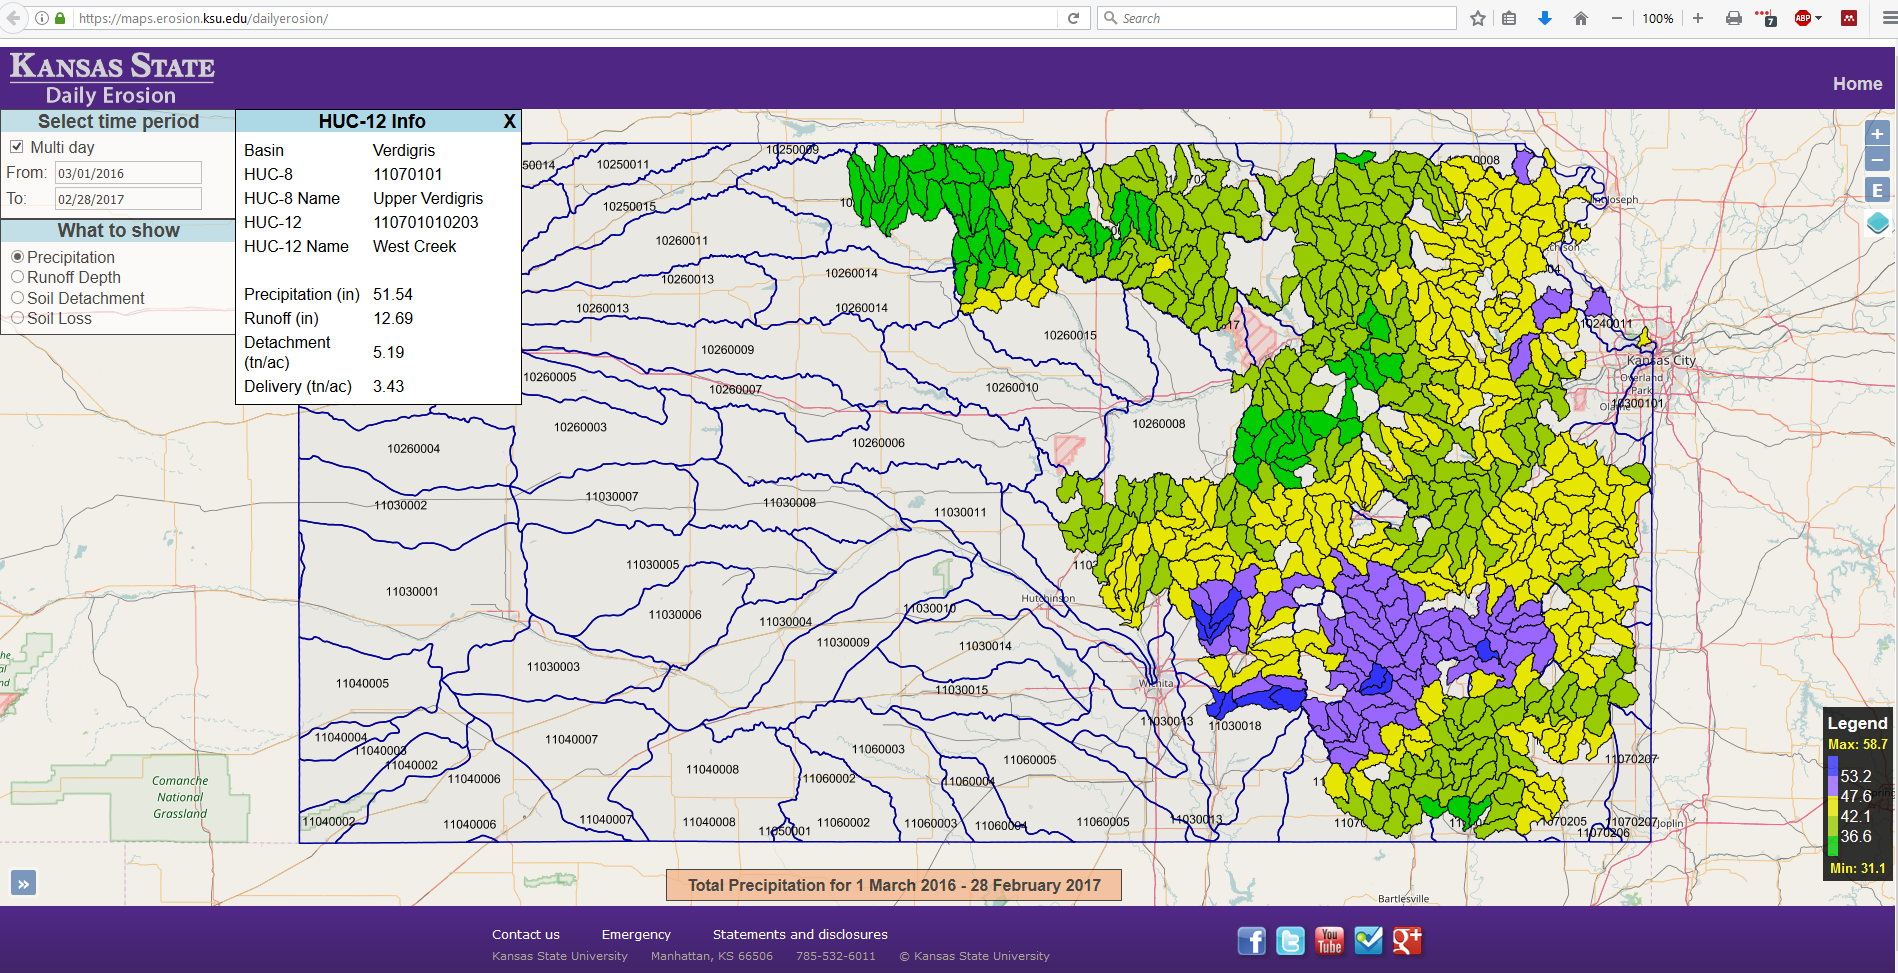
The Kansas Daily Erosion Project (DEP) is an online tool that estimates soil erosion rates on cropland hillslope on a daily basis for each Hydrologic Unit Code 12 area (HUC-12; about 20,000 acres) in Kansas. The erosion results are updated every morning around 7:00 am after 4 hours of simulations on thousands of hillslopes in Kansas with 15-minute precipitation records from the previous day. Simulations are conducted in collaboration with Iowa State University (Drs. Rick Cruse and Brian Gelder) as part of Regional Daily Erosion Project. Model outputs visually illustrate average HUC-12 daily precipitation, water runoff, hillslope soil detachment, and hillslope soil loss in an interactive mapping format on the internet easily understood. Map display is available at: http://maps.erosion.ksu.edu/dailyerosion/.
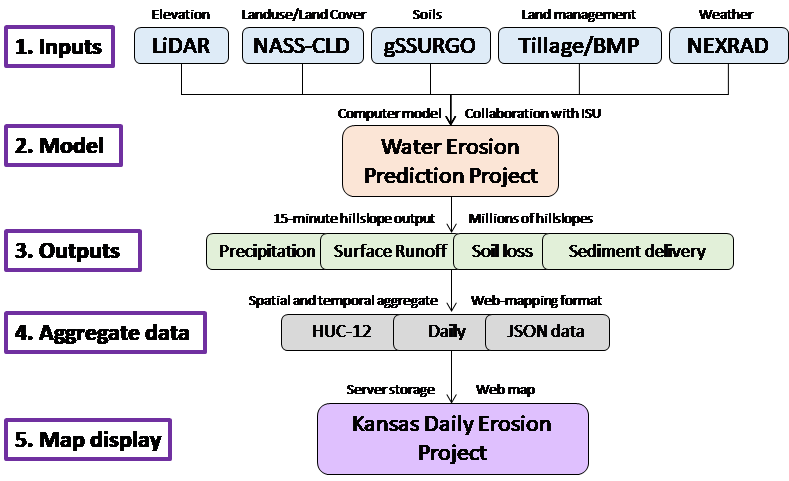
The flowchart of DEP components above highlights five steps in DEP process:
- The first step involves data collection for the state of Kansas and consists of datasets of elevation, land use/land cover, soils, land management, and weather. More than 700 GB of data was collected by PI Sheshukov from various online and private databases in 2015-2016 for years 2007 forward. The collection was processed with the tools developed by PI and ISU collaborators and prepared for daily modeling.
- The second step involves simulating hillslope hydrology and water-quality at each hillslope with Water Erosion Prediction Project (WEPP) model (Flanagan and Nearing, 1995). WEPP simulates rill and interrill erosion by rainfall and runoff. The basic element, on which WEPP is implemented, is an overland flow element, which is a hillslope segment that represents a unique combination of slope, soil type, and land use. Land management, conservation practices, and operations are pre-processed for each day.
- WEPP model generates surface runoff and spatiotemporal distributions of soil loss and sediment delivery for each hillslope at 15-minute intervals for each day from 2007 to 2017.
- At step 4, all outputs are aggregated daily for HUC-12 areas. This aggregation eliminates concerns related to private information of each hillslope and reduces model uncertainty associated with potential inaccuracy of daily management by producers. The results are converted into a JSON data format and prepared to be acquired by web servers.
- The final step of KDEP process deals with providing user-friendly interface for any users to view the developed information on the web or in a printed format. The results are updated every morning with data collected from the previous day. The current coverage is for 42 counties, 17 HUC-8 watersheds, and 572 HUC-12 areas.
Click on image to view DEP map display: